Suppose you are Netflix, and you are storing the list of movies that each user has watched. For a simple recommendation system, given a user, you want to know which other users' film lists their watched set of movies overlap with. You have too many users to just compare with everyone. You need an index – a set database.
I recently published a preprint, together with Jakob Knudsen, describing a new, optimal data structure for set similarity search. An interesting way to look at this is as an Evolutionary Algorithm (aka genetic algorithm). We think it's probably the first time the provably best way to solve a problem has been evolutionary. This post won't go deep into the mathematics, but will contain code samples and some fun gadgets I built to simulate it.
You should know that sets can represent much more than movies, and that this problem has been studied in Computer Science since the 70s, but for now, let's focus on the concrete.
Assume Alice has watched the movies { Extraction, The Rise of Skywalker, Dangerous Lies, The Half of It, 365 Days, Once Upon a Time, The Gentlemen, Parasite, Bad Education }. We might make a list of users for every movie that exists, and write down Alice in the lists corresponding to Extraction → [Alice], The Rise of Skywalker → [Alice], ... etc. This is called an Inverted index. If another user, Bob, shares just one movie with Alice, he will discover this by looking through the sets in lists corresponding to the movies he has watched himself. Meanwhile, if a third user, Eve, has no movies in common with Alice, Eve won't waste any time on Alice, since she isn't on any of Eve's lists.
Unfortunately, everybody has seen Titanic (at least an estimated 211 million American adults.) Hence the simple list approach doesn't save Bob much time. The solution is to have the index keyed by pairs, triples or in general n-tuples of movies, rather than single movies. We also pick those tuples randomly, so even if there are 5 specific movies everyone has seen, that 5-tuple probably won't be chosen and it won't be a problem.
We are now pretty close to the real algorithm. The last change we will make is to allow people to appear in lists, even if they have only watched, say, 80% of the movies in the list. In fact, we will require close to exactly 80%, since there is also information in what movies people haven't watched.
An example of the data structure is shown below:
   from random import sample
   movies = [...] # 100 movies in total
   names = [...] # 200 users in total
   # Sample a lot of keys of 6 movies each
   keys = [set(sample(movies, 6)) for _ in range(1000)]
   # Sample 30 watched movies for each user
   watched = [(name, set(sample(movies, 30))) for name in names]
   for key in keys:
      # Place a user in a list if the overlap with the key is 5/6
      print(key, '→', [name for name, mvs in watched if len(key & mvs) == 5])
Which results in the following output:
   { Lawrence of Arabia, Forrest Gump, The Wizard of Oz, ...} → [William]
   { Rocky, Saving Private Ryan, Good Will Hunting, ...} → []
   { It's a Wonderful Life, Amadeus, Sunset Blvd., ...} → [Robert, Dennis]
   { Casablanca, The Princess Bride, Blade Runner, ...} → [Brandon, Kyle]
   { Singin' in the Rain, The Matrix, Raging Bull, ...} → [Patricia, Ruth, Sarah]
   ...
Now, if we inspect the overlap between movies watched by Patricia and Ruth, we find it is 13. Nearly 50% larger than the expected 30/100 · 30/100 · 100 = 9. Perfect! We managed to organize the sets so similar ones are close together!
Intuition: Why should we expect that two sets with a shared key-set have a large overlap? This follows from Bayes' theorem in statistics: A given key-set is more likely to appear in two sets with a large overlap. Therefore two sets with a large overlap are also more likely to share a key-set.
"But", you ask, "haven't we just replaced the problem of finding a movie set with a large overlap, with finding a key-set with a large overlap?"
This is a major problem, and it's likely the reason that the simple idea above hasn't been feasible to use before now. It turns out that we can use key-sets that are only partially random. This is what finally brings us back to the topic of Evolution and Corona outbreaks.
The idea of Evolutionary Algorithms is to mimic natural selection. Given some problem, for which good solutions are hard to come by, we start with a small, random population and let it evolve. At each generation, we select only the fittest for reproduction. In our case, it is the key-sets we want to evolve, and the problem is to find key-sets that have a large overlap with our set of watched movies. Hence we define the fitness to be the size of this overlap.
The following model shows what the algorithm looks like in practice:
The circles on the left are the universe of possible set elements. (The total archive of movies.) The blue circles are the movies we have watched. On the right are the key-sets that we are evolving. Each individual is allowed to multiply if roughly 80% of its elements are from our set.
Technical point: When new key-sets are evolved by sampling from the universe, the randomness is shared between all users. This means that the total family of key-sets that can be evolved is shared between them. However each user has a different fitness function (the overlap with their personal set), and they focus their effort evolving the key-sets relevant to them.
In the following figure, we show what it looks like when both Alice and Bob are running the evolution at the same time, on different sets (resp. blue and orange). We only show the key-sets that both Alice and Bob keep, though they naturally don't know each other's sets, so on their parts, they have to keep as much as in the previous plot.
It is naturally harder to guarantee the survival of the tribe if we have two requirements that must hold at the same time. In the figure, we have thus increased the branching factor to 3, (and the fitness threshold to 84%.)
The figure shows clearly why pairs of sets with a large overlap are likely to result in shared key-sets: As you may try, it is nearly impossible to evolve large key-sets without using lots of multi-coloured balls.
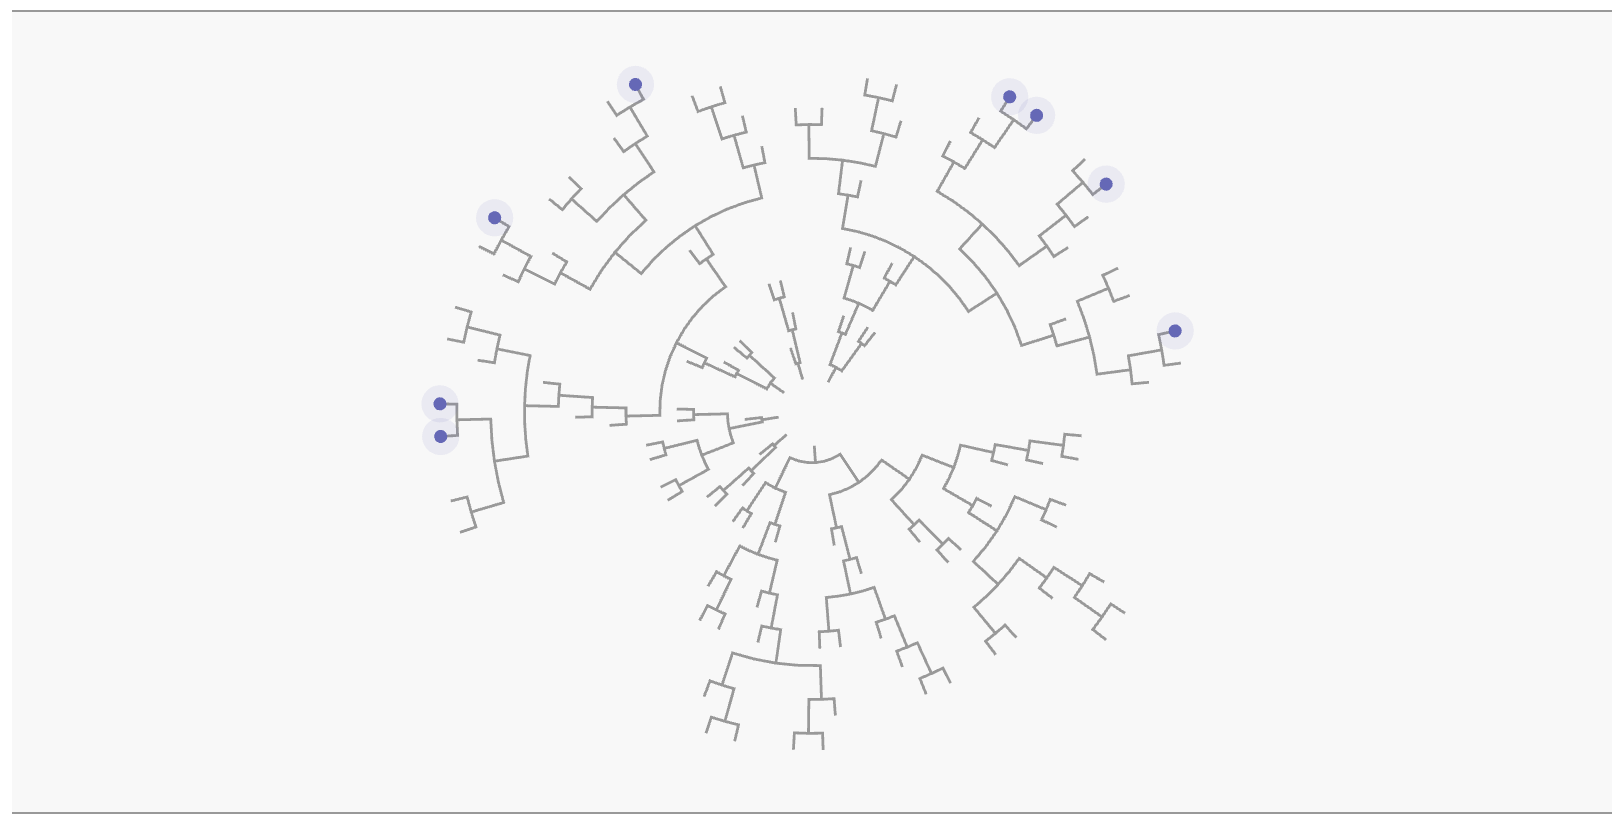
The Tree of Life in biology illustrates how every species of life originally evolved from one ancestor. Like Darwin, we too can plot the ancestry of the species we evolve.
In the first simulation, the fit individuals of each generation would double themselves. If we weren't constantly abandoning a large portion of them, the exponential growth would quickly make them grow to extreme numbers. In terms of Coronavirus jargon, this means the reproduction number (or R-value) would be greater than 1.
It turns out, however, that with a fitness threshold of 80%, and a density of blue balls of 25% as in the example above, a branching rate of 2 is exactly the right balance to ensure long time survival of the tribe, but never have it grow exponentially.
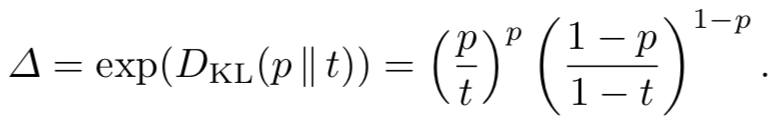
Technical details: The required branching factor for stable growth (neither exploding nor extincting) turns out to be related to the so-called Kullback–Leibler divergence between the density of the set in the universe (p) and the survival threshold (t). We need the branching factor to be exactly
However, for the real algorithm, we need to ensure that some key-set survives for both Alice and Bob. That requires a two-dimensional version of Kullback–Leibler, which I won't even try to state here.
The next gadget allows you to try different "blue ball densities" and thresholds, and see how many generations the tribes survive. Note that if you manually modify the branching factor, the tribe will either quickly go extinct, or explode to kill your browser tab.
This simulation doesn't show us how many blue and grey balls are in each individual. Instead, we will plot histograms of the fitness of each generation to get an idea of how stable our growth is:
While the arXiv paper proves that the above method of searching sets is optimal in terms of big-O time and space, in practice we probably need a number of hardware- and dataset related optimizations to get competitive performance.
It is however simple to write a toy Python version of the data structure. The most important piece is the method that generates the key-sets:
def representatives(self, point):
    # Do a small number of independent repetitions to ensure success
    for seed in self.seeds:
        # Each individual stores its value and a random identifier
        individuals = [(0, seed)]
        size = 1
        # Run through k generations/levels of the process
        for l in range(1, self.k+1):
            # The branching factor might not be an integer, so we
            # round it up, while trying to keep the geometric average
            # correct
            level_size = math.ceil(self.D**l / size)
            size *= level_size
            new_individuals = []
            for v, h in individuals:
                # Evolve the individual by generating children.
                # We seed the random generator so the children chosen
                # are consistent between inserts and queries
                random.seed(h)
                for x in random.sample(range(self.U), level_size):
                    h1 = random.randrange(self.U**3)
                    v1 = v + bool(x in point)
                    # We allow the value to be "off" by a tiny bit
                    if abs(v1 - self.t*l) <= (self.t*(1-self.t)*l)**(1/3):
                        new_individuals.append((v1, h1))
            individuals = new_individuals
        yield from (h for v,h in individuals)
There are a number of parameters used:
self.D is the branching factor Δ.self.t is the threshold t requirement for key-set fitness.self.k is the size of the final key-sets we are trying to generate.self.U is the size of the universe from witch the sets are drawn (e.g. all movies in the Netflix catalog.)The code keeps track of the value (number of sampled items that came from the given set) and a hash of the given key-sets. This hash is enough to identify the individual, so, we don't have to store the elements actually sampled. The hash is also used to seed the random generator, which ensures that a given individual always has the same offspring - what was earlier described as "coordinated randomness".
The actual methods to insert and query the data structure are incredibly simple:
def insert(self, point):
    for rep in self.representatives(point):
        self.lists[rep].append(point)

def query(self, point):
    for rep in self.representatives(point):
        for point2 in self.lists[rep]:
            yield point2
For the complete code of the Python implementation, see the GitHub repository. The only thing it includes beyond the code above, is the following initialization:
def __init__(self, U, t):
    self.U = U
    self.t = t
    self.k = find_height(...)
    self.D = find_branch_factor(...)
    surv = estimate_survival(self.D, self.k, ...)
    self.seeds = [random.randrange(U**3) for _ in range(int(1/surv+1))]
    self.lists = collections.defaultdict(list)
The estimate_survival function runs a simple simulation, used for estimating how many individuals need to be in the first generation, to guarantee we don't get early extinction.
Finally, the self.list map, stores the actual lists illustrated in the previous section.
Finally, let's make a small toy recommendation system:
from supermajority import Supermajority

total_movies = 100_000
watchsets = {'Alice': {0, 4, ...}, 'Bob': {1, 3, ...}, ...]

U, n = len(all_movies), len(watchsets)
# Users may not have watched the same numnber of movies. We shoud really make
# multiple Supermajority()'s to account for this, but we'll just estimate using
# the average.
wu = wq = sum(len(watched) for name, watched in watchsets) / len(watchsets) / U
# We'll focus on overlaps of roughy half the set size.
w1 = wq / 2
# q_weight controls how to balance query time to data structure space.
sm = Supermajority(U, wq, wu, w1, n, q_weight=1)

print('Building data structure')
sm.build(watchsets.vaulues())

print('Querying data structure')
query = watchsets['Bob']
cnt = collections.Counter()
for watched in sm.query(query):
    # We could weight the counts by how good an overlap there is between
    # Bob and `watched`, but here we just add everything equally
    for movie in watched:
        cnt[movie] += 1

# Print top 10 suggestions
print('Suggestions:', cnt.most_common(10))
You can try it out the Netflix price data. To get competitive recommendations, you probably have to account for the skewed distributions of movies watched, as well as weighing for the rating and time at which it was given.
Sets can be used to represent many types of data, other than lists of movies. In DNA sequencing, the DNA strings are chopped into sets of small snippets (called k-mess) such that two sets with a large overlap "contains roughly the same genes". When I worked in Machine Learning for customer support, we would sometimes represent the customers' queries as a Bag-of-words, and two sets with a large overlap would be considered to be about the same issue.
The difficulty of set similarity is related to the Curse of dimensionality. Turing Award-winning Ronald Rivest wrote his PhD Thesis on a version of this problem all the way back in 1976. In the late 90s, the methods of Locality Sensitive Hashing and the MinHash were developed, which are used today in everything from search engines to Machine Learning. There are also Machine Learning techniques such as Word embeddings that "densifies" sets to vectors. However, it turns out that one can do better by looking at the sets directly.
It is also worth noting, that while the present algorithm works on sets, it can easily be generalized to weighted sets or multisets. This is done just like Incorporating Weights in MinHash. Similar techniques allow handling Neural or "Visual" Bags of Words like SIFT.
 A picture illustrating the visual Bag-of-words model for image search, credit Wikimedia Commons.
If you take anything away from this post, I hope it is that evolution can be finicky and very sensitive to parameters such as the branching factor. If used responsibly, however, evolutionary algorithms can be a powerful way of solving problems. Even undertakings as abstract as recommendation systems and set databases.
The problem of search and joins on sets has been studied for 50 years. Various models have been suggested, such as Subset search and Jaccard similarity search. The method described above is the first mathematically optimal algorithm for all of those problems, potentially leading to vastly more efficient systems in all areas of Computer Science.